
What a pleasure to have support within minutes. Brillant, accurate answer, and solved the question. Thanks to the Formidable Team. Eric


Last updated on August 12, 2026 by Formidable Team
How To Create Charts in WordPress (3 Simple Steps)
Looking to make WordPress charts and graphs? This post will show you how to create charts in WordPress and display them on your site!

Approximate read time: 6 minutes
Are you working on a WordPress website that needs to make some data shine?
Adding a dynamic chart or graph is a great way to get visitors' attention while also sneaking in some statistics.
But it's tough to make a chart for WordPress, right? It's much easier than you think, especially using the right tool.
In this post, we'll quickly cover what we look for in a good chart plugin and show you exactly how to create charts for WordPress without writing a single line of code!
Upgrade your WordPress site with powerful, flexible forms.
Use a WordPress charts and graphs plugin
Sure, graphs seem simple at first glance. But behind the scenes, they can be complicated to code.
But why spend hours learning to make an interactive chart from scratch when you can quickly install a plugin to handle the hard stuff?
A good WordPress chart plugin offers the following:
- Ease of use: In a few clicks, your data is turned into eye-catching visuals.
- Several chart types: Pie, scatter, bubble chart... you name it! You can switch it up in a second.
- Frequent updates: Your charts will keep looking good year after year.
- And more time to do what you love!
So, which plugin is the best for making charts in WordPress? The answer is Formidable Forms!
That's right, the best WordPress form builder is the best chart plugin for WordPress.
Now, let's see how easy it is to create charts for WordPress with Formidable Forms.
From Idea to Reality in Minutes. Build Powerful Forms, Dashboards, Apps and More.
Formidable Forms makes advanced site building simple. Launch forms, directories, dashboards, and custom WordPress apps faster than ever before.
How to create charts for WordPress

So, it's only a few simple steps to create a chart for WordPress:

You'll need the Formidable Forms WordPress plugin to follow this step-by-step tutorial. The graphs and charts add-on is included in Formidable's Plus plan and above.
If you don't have it yet, click below to get your license! 👇
Once you've installed and activated Formidable, we can start making our chart!
For today's example, we'll use our premiere birdwatching blog, Here Birdie Birdie.

On our website, we built a form for visitors to report the birds they spot. The site then automatically publishes each entry as a blog post. Cool, right?

While this works great for sharing details, many visitors have asked which birds are seen the most.
Instead of fighting with CSV files and Google Sheets to do the math and create visuals, charts, or graphs, let's add a responsive chart to our site showing the number of sightings of each kind of bird.
Step 1: Install the Formidable Forms chart plugin
In the WordPress admin, navigate over to Formidable → Add-Ons. Search for the Charts add-on, then click the blue button to Install, and Activate it.
Great, now on to the fun stuff!
Step 2: Add the Formidable Chart block to your page
Next, let's create the WordPress page/post where we want to insert our chart. For example, we'll make a new page called "Bird Watching Statistics."
In the Gutenberg editor, click the ➕ icon to add a new block. Next, search for "Formidable" and insert the Formidable Chart block.

From the right sidebar, select the form to use as your data source. We should now see some data! 📊

Don't see the data source selector? You may need to open the sidebar by clicking the button in the top right corner of the WordPress editor.
Step 3: Edit your chart in WordPress
We thought a column graph (a bar chart) would work best to show how many times a type of bird has been seen. Lucky for us, that's the default chart type!
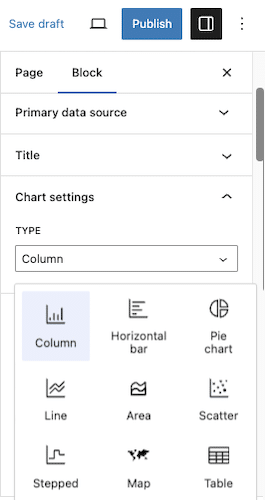
The next step in creating our column chart/bar graph is to specify the x-axis and y-axis data sources in the sidebar.
In this case, we'll set the x-axis to "Bird type" and the y-axis to "The number of entries."

Not bad, but it could look better...
Style your chart or graph in WordPress
Let's change the colors of our chart to make things a little flashier.
To do this, go over to the right sidebar. Under Appearance, select the colors you want.

Now, that chart's sure to catch a birder's eye! 👀

But our chart could still be better.
Change the chart type
Instead of a column graph, a pie chart might be a better way to visualize our data. 🥧
So, how can we insert a pie chart in WordPress?
We'll go to the right sidebar and change the Type from Column to Pie. Yep, Formidable Forms works as a pie chart plugin, too!

And there we go! We now have a WordPress pie chart showing the percentage of each answer we received in our form!
For the finishing touch, we'll toggle the Legend button in the sidebar to clarify things.

All that's left is to publish our page. We now have a pie chart on our WordPress site that'll update in real-time when someone submits our form! Pretty fly! 🦅 (We're 99% sorry for that joke).
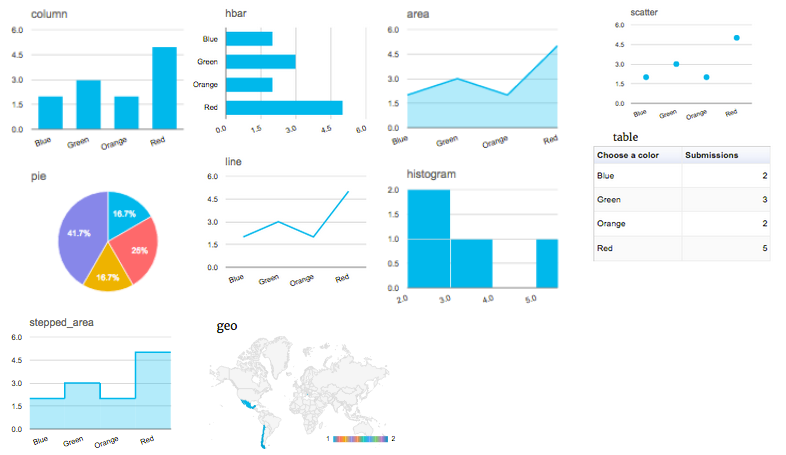
Don't want a column or pie chart? No problem! Formidable's Chart block lets you change between all types of charts and tables in a single click:
- Pie chart
- Bar chart (bar graph)
- Line chart (line graph)
- Scatter plot
- Area chart
- Stepped chart
- Map
And Formidable doesn't stop at building forms and creating charts for WordPress. The pro version also comes with:
- Responsive tables and charts for any theme (including Elementor)
- WooCommerce integration
- Payment gateways
- WordPress application builder
- And much more
One plugin can do all that? Impressive!
Ready to create charts for WordPress?
Don't let WordPress charts ruffle your feathers. Instead, install Formidable Forms and use its powerful data visualization features!
So, forget about searching for a separate graph or chart plugin. To create charts in WordPress, you only need a great WordPress form builder.
But don't forget to follow us on Facebook, Twitter, and YouTube for more WordPress tips and tricks!
Read more about charts for WordPress
 How To Analyze Survey Results Right in WordPress
 How To Create a Fitness Tracker in WordPress
 How to Calculate a 5 Star Rating Average in WordPress
This article may contain affiliate links. Once in a while, we earn commissions from those links. But we only recommend products we like, with or without commissions.