
Display a graph of your form's entries on any page, post, View, widget, etc. These graphs display live data and update automatically whenever an entry is added or updated. Check out your form's Reports tab to see the default graphs for your form. Our graphs rely on the Google chart HTML5/SVG technology.

There are several ways to publish a chart or graph.
Upgrade your WordPress site with powerful, flexible forms.
Use the Wordpress block editor
Using the Formidable Chart block, you can easily add a chart to a page. Learn more about how to create a chart.
From Idea to Reality in Minutes. Build Powerful Forms, Dashboards, Apps and More.
Formidable Forms makes advanced site building simple. Launch forms, directories, dashboards, and custom WordPress apps faster than ever before.
Use the shortcode builder
- Go into a WordPress page, post, or View.
- Click on the Formidable button above the content box.

- Click the Graph tab on the left side of the pop-up.
- Select the form and then select the field which holds the data you would like to display. Configure any other options that you would like.
- Click the Insert into Post button.

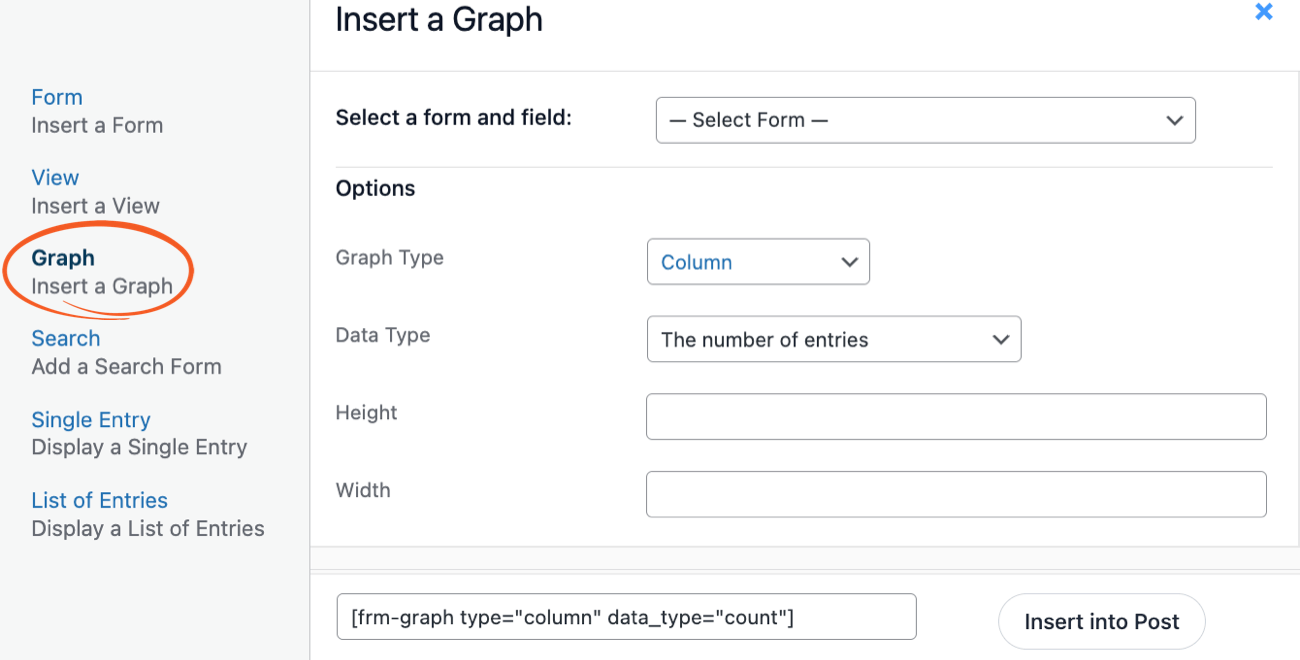
Please note that the shortcode builder does not include all the graph options. If you would like to see the many graph options available, please read more about the graph shortcode.
Insert the shortcode manually
Insert the following shortcode on any page, post, View, widget, or inside an HTML field in a form.
[frm-graph fields="x,y,z"]
Replace x, y, and z with field IDs or keys. There are many parameters you can use to customize your graph. Read more about the graph shortcode.
Graph shortcode
The graph shortcode is used to insert a graph on your site. Review the parameters below to learn about the many graphing options available to you.
Required parameters
One of the following parameters must always be included in your graph shortcode, but you may not use both parameters together.
- fields: The IDs/keys of the fields you would like to graph. You can graph a single field or multiple fields.
[frm-graph fields="x,y,z"]
The fields option will use fields in the order they are specified. For example, when using [frm-graph fields="20,10"] field ID 20 will appear before field ID 10.
- form: The ID or key of the form you would like to graph.
[frm-graph form="x"]
When this parameter is used, the default setting will display the form name if no title option is specified. It can also reference the name of the first field when fields are specified, as this will follow the same truncation rules as the form name.
Graph types
Formidable Pro offers a variety of graphs designed to address your data visualization needs. The following graph types are available: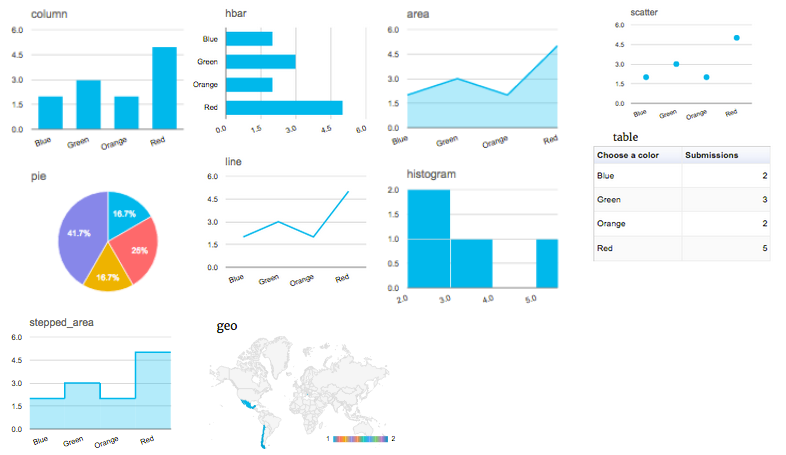
Use the type parameter to determine your graph type. If no graph type is specified, a column graph will be created.
How to Create Charts and Graphs from WordPress Forms
Table
A table chart displays the submission totals in a table.

[frm-graph fields="x" type="table"]
- Replace x with the field ID or key you would like to graph.
Column
A column graph consists of vertical columns or bar.
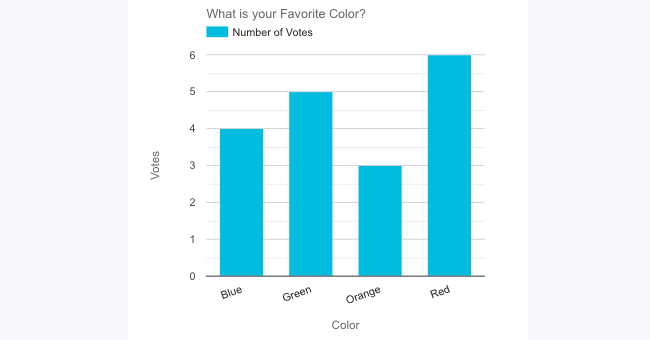
[frm-graph fields="x" type="column" title="What is your Favorite Color?" y_title="Votes" x_title="Color" show_key="1" legend_position="top" tooltip_label="Number of Votes"]
- Replace x with the field ID or key you would like to graph.
- By default, it will count the number of entries. To define the x-axis with the ID of a second field from the same form, use the x_axis parameter
Horizontal bar
A horizontal bar graph consists of horizontal columns or bars.
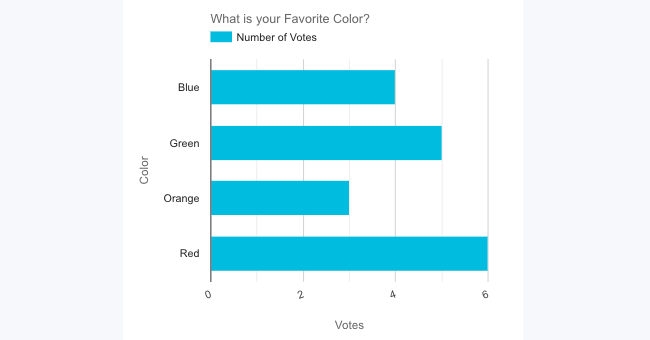
[frm-graph fields="x" type="hbar" title="What is your Favorite Color?" x_title="Votes" y_title="Color" show_key="1" legend_position="top" tooltip_label="Number of Votes"]
- Replace x with the field ID or key you would like to graph.
- By default, it will count the number of entries. To define the x-axis with the ID of a second field from the same form, use the x_axis parameter
Pie
A pie graph is a circle divided into sectors that each represent a proportion of the whole.
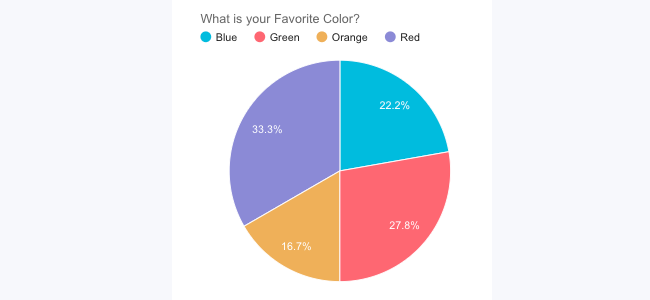
[frm-graph fields="x" type="pie" title="What is your Favorite Color?" show_key="1" legend_position="top"]
- Replace x with the field ID or key you would like to graph.
Line
A line graph consists of line segments that connect data points.
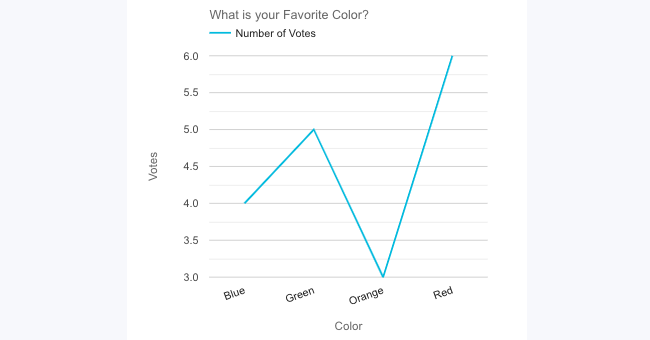
[frm-graph fields="x" type="line" title="What is your Favorite Color?" y_title="Votes" x_title="Color" show_key="1" legend_position="top" tooltip_label="Number of Votes"]
- Replace x with the field ID or key you would like to graph.
- By default, it will count the number of entries. To define the x-axis with the ID of a second field from the same form, use the x_axis parameter
Area
An area graph is a line graph with the area below the line filled in.
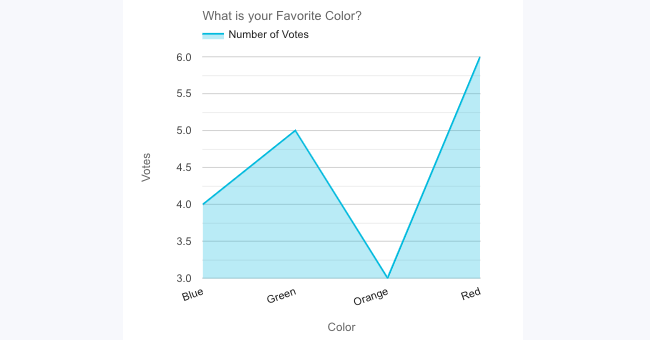
[frm-graph fields="x" type="area" title="What is your Favorite Color?" y_title="Votes" x_title="Color" show_key="1" legend_position="top" tooltip_label="Number of Votes"]
- Replace x with the field ID or key you would like to graph.
- By default, it will count the number of entries. To define the x-axis with the ID of a second field from the same form, use the x_axis parameter
Scatter
A scatter graph is a set of points plotted on horizontal and vertical axes.

[frm-graph fields="x" type="scatter" title="What is your Favorite Color?" y_title="Votes" x_title="Color" show_key="1" legend_position="top" tooltip_label="Number of Votes"]
- Replace x with the field ID or key you would like to graph.
- By default, it will count the number of entries. To define the x-axis with the ID of a second field from the same form, use the x_axis parameter
Stepped area
An stepped area graph is an area chart which uses vertical and horizontal lines to connect the data points in a series forming a step-like progression.

[frm-graph fields="x" type="stepped_area" title="What is your Favorite Color?" y_title="Votes" x_title="Color" show_key="1" legend_position="top" tooltip_label="Number of Votes"]
- Replace x with the field ID or key you would like to graph.
- By default, it will count the number of entries. To define the x-axis with the ID of a second field from the same form, use the x_axis parameter
Histogram
A histogram graph consists of rectangles showing the frequency of data items in successive numerical intervals of equal size.
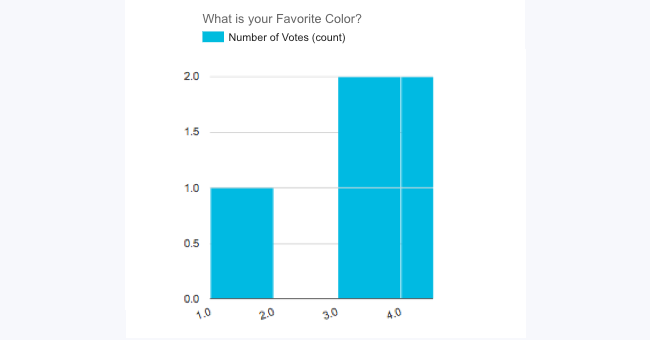
[frm-graph fields="x" type="histogram" title="What is your Favorite Color?" show_key="1" legend_position="top" tooltip_label="Number of Votes"]
Geo
A geo chart is a map of continents with colors and values assigned to specific regions. Values are displayed as a color. This type will only work with a Country field, like a dropdown, Lookup field, or Dynamic dropdown. It will look best with just one or two colors.
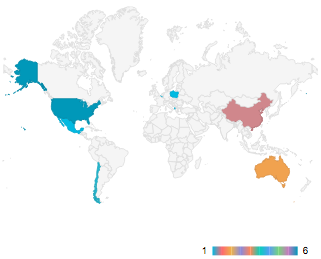
[frm-graph fields="x" type="geo" colors="#EF8C08"]
Configure the x-axis
If you would like to configure the x-axis for your graph, you may use the parameters listed below. Please note: This can only be used with graph types that have horizontal and vertical axes.
-
x_axis
Use the x_axis parameter to define the x-axis with the ID of a second field from the same form. You can also use created_at or updated_at to graph entries over time.
[frm-graph fields="x" x_axis="created_at"]
-
include_zero
When using date fields, created_at, or updated_at for the x_axis parameter, you can include all dates (between your start and end dates) on the x-axis, even if they don't have a submission on that date.
When using radio, checkbox, or dropdown fields, options that not yet been selected in an entry will also be included in the graph.[frm-graph fields="x" x_axis="y" include_zero="1"]
-
group_by
Group entries by month, quarter, or year. This parameter will only apply if x_axis is included.
[frm-graph fields="x" x_axis="created_at" group_by="month"]
-
is_stacked
Place related values atop one another. If there are any negative values, they are stacked in reverse order below the chart's axis baseline. Please note: This will only apply when graphing multiple fields. This parameter will only apply if x_axis is included.
[frm-graph fields="x,y" x_axis="created_at" is_stacked="1"]
-
data_type
Specify whether to display the number of entries, the total value of those entries, the average value, or the minimum/maximum value from a set of entries. This parameter will only apply if x_axis is included.
- count: Show the number of entries.
[frm-graph fields="95" x_axis="created_at" data_type="count"]
- total: Show the sum of the specified field's values.
[frm-graph fields="95" x_axis="created_at" data_type="total"]
- average: Show the average or mean value for the selected fields.
[frm-graph fields="95" x_axis="created_at" data_type="average"]
- minimum: Identify the lowest value among selected fields.
[frm-graph fields="95" x_axis="created_at" data_type="minimum"]
- maximum: Identify the highest value among selected fields.
[frm-graph fields="95" x_axis="created_at" data_type="maximum"]
- count: Show the number of entries.
X-axis display options
Use the parameters below to customize the display of your graph's x-axis. These parameters will only apply to graphs with a horizontal and vertical axis.
-
x_title
Set the title of the x-axis.
[frm-graph fields="x" x_title="X axis title"]
-
x_title_size
Set the font size of the x-axis title. This parameter will only apply if x_title is included.
[frm-graph fields="x" x_title="X axis title" x_title_size="20"]
-
x_title_color
Set the font color of the x-axis title. This parameter will only apply if x_title is included.
[frm-graph fields="x" x_title="X axis title" x_title_color="#666"]
-
x_labels_size
Set the font size of the labels on the x-axis.
[frm-graph fields="x" x_labels_size="15"]
Hide the x axis labels by setting the size very small:
[frm-graph fields="x" x_labels_size="0.1"]
-
x_slanted_text
By default the labels on the x-axis are slanted. To remove the slant and make the labels horizontal, use x_slanted_text=0.
[frm-graph fields="x" x_slanted_text="0"]
-
x_text_angle
Set the angle of the slanted text labels on the x axis.
[frm-graph fields="x" x_text_angle="80"]
-
x_show_text_every
Determine how often an x-axis label should be displayed. If you would like to show the x-axis label for every bar or coordinate, use x_show_text_every="1". If you would like to show the x-axis label for every three bars or coordinates, use x_show_text_every="3".
[frm-graph fields="x" x_show_text_every="3"]
-
x_min
Set the minimum value of the x-axis.
[frm-graph fields="x" x_min="5"]
-
x_max
Set the maximum value of the x-axis.
[frm-graph fields="x" x_max="10"]
-
x_order
Determine the order for your x-axis labels. By default, a field's options will be graphed alphabetically. You may reverse this order with x_order="desc". If you're graphing a checkbox, dropdown, or radio button field and you would like to remove alphabetical ordering, add x_order="field_opts" to your graph shortcode. When you remove alphabetical ordering, the options will be graphed in the same order as your field options.
[frm-graph fields="x" x_order="field_opts"]
Y-axis display options
Use the parameters below to customize the display of your graph's y-axis. These parameters will only apply to graphs with a horizontal and vertical axis.
-
y_title
Set the title of the y-axis.
[frm-graph fields="x" y_title="Y axis title"]
-
y_title_size
Set the font size of the y-axis title. This parameter will only apply if y_title is included.
[frm-graph fields="x" y_title="Y axis title" y_title_size="20"]
-
y_title_color
Set the font color of the y-axis title. This parameter will only apply if y_title is included.
[frm-graph fields="x" y_title="Y axis title" y_title_color="#666"]
-
y_labels_size
Set the font size of the labels on the y-axis.
[frm-graph fields="x" y_labels_size="15"]
-
y_min
Set the minimum value of the y-axis.
[frm-graph fields="x" y_min="5"]
-
y_max
Set the maximum value of the y-axis.
[frm-graph fields="x" y_max="10"]
Title display options
Use the parameters below to customize the display of your graph's title. These parameters will not apply to geo graphs.
-
title
Set the graph title.
[frm-graph fields="x" title="My Graph"]
-
title_size
Set the font size of your graph title.
[frm-graph fields="x" title_size="20"]
-
title_font
Set the font family of your graph title.
[frm-graph fields="x" title_font="Lucida Sans Unicode"]
-
title_bold
Make the graph title bold with title_bold="1".
[frm-graph fields="x" title_bold="1"]
-
title_italic
Make the graph title italic with title_italic="1".
[frm-graph fields="x" title_italic="1"]
-
title_color
Set the color of the graph title.
[frm-graph fields="x" title_color="#666"]
-
truncate
Truncate the graph title to the specified number of characters. This parameter is only applied if the default graph title is used. By default, the value is set to 40.
[frm-graph fields="x" truncate="40"]
The title option automatically overrides the truncate option.
Display options
For display options of your graph, use the parameters below.
-
colors
Customize the graph colors with a comma separated list of 6-digit hex colors
[frm-graph fields="x" colors="#EF8C08, #21759B, #1C9E05"]
-
bg_color
Change the background color.
[frm-graph fields="x" bg_color="#FFFFFF"]
-
grid_color
Change the color of the horizontal lines on the graph.
[frm-graph fields="x" grid_color="#000000"]
-
x_grid_color
Change the color of the vertical lines on the graph.
[frm-graph fields="x" x_grid_color="#ffffff"]
-
height
Set the graph height. If not specified, this defaults to 400.
[frm-graph fields="x" height="200"]
-
width
Set the graph width to pixels or a percent. If not specified, this defaults to 400.
If you have set the width to percent, it will make the graph responsive.[frm-graph fields="x" width="25%"]
-
chart_area
Set the placement and size of the chart area to pixels or a percent.
[frm-graph fields="x" chart_area="height:100%, width:100%, top:10, left:20"]
-
is3d
Turn your graph three-dimensional. This option is only available for pie graphs.
[frm-graph fields="x" type="pie" is3d="true"]
-
pie_hole
Turn your pie graph into a donut graph. This option accepts values between 0 and .9, corresponding to the ratio of the donut hole to the chart.
[frm-graph fields="x" type="pie" pie_hole=".5"]
-
curve_type
Smooth the lines of a line graph.
[frm-graph fields="x" type="line" curve_type="function"]
-
no_data
Determine the message that will display when there is no data to be shown on the graph.
[frm-graph fields="x" no_data="There is no data to display"]
-
pagesize
Add pagination when using the table graph type.
[frm-graph fields="x" type="table" pagesize=20]
-
sort_column
Change the column to sort by on page load when using the table graph type. 0 is the first column and 1 is column 2.
[frm-graph fields="x" type="table" sort_column=1]
-
sort_ascending
Change the sorting order on page load when using the table graph type.
[frm-graph fields="x" type="table" sort_ascending=1]
Animation options
To enable animation options for your graph and enhance its visual appeal, use the parameters provided below. These options let you customize the animation behavior, making your graph more dynamic and engaging to viewers.
-
animate
Enables animations. By default, this lasts for 1000ms (1 second) with the out easing type. It accepts the values 0 and 1.
[frm-graph fields="x" animate="1"]
-
animation_duration
Adjusts the duration. By default, the value is set at 1000ms. It accepts any numerical number in milliseconds.
[frm-graph fields="x" animation_duration="500"]
-
animation_easing
Changes the easing type. By default, the value is set to out (start fast, end slow). It can handle the following values: linear, in, out, and inAndOut.
[frm-graph fields="x" animation_easing="in"]
Legend options
Include a legend for your graph. This is most helpful if you are graphing multiple fields on the same graph. Use the parameters below to configure your legend.
-
show_key
Display a legend with your graph. Change this to show_key="0" if you want to hide the legend.
[frm-graph fields="x" show_key="1"]
-
legend_position
Change the position of the legend using top, bottom, left, or right. This parameter will only apply if show_key is included.
[frm-graph fields="x" show_key="1" legend_position="top"]
Please note when using the 'left' position, it will only show up on the pie and geo charts.
-
legend_size
Change the size of the legend in pixels. This parameter will only apply if show_key is included.
[frm-graph fields="x" show_key="1" legend_size="20"]
-
tooltip_label
Change the default tooltip label for a graph. The tooltip label defaults to the field title.
[frm-graph fields="x" show_key="20" tooltip_label="Submissions"]
Filtering parameters
Use the parameters below to filter and limit the data displayed in your graph.
-
user_id
Graph entries for a specific user or for the current logged-in user. Insert the ID of a specific user or use 'current' to only graph data from the current user.
[frm-graph fields="x" user_id="current"]
-
entry
Display a graph of a specific entry or entries. You may use entry IDs or keys.
[frm-graph fields="x" entry="41245,28374,28498"]
-
drafts
By default, the frm-graph shortcode does not include draft entries. You can choose to include only drafts using drafts="1", or both drafts and entries using drafts="both".
[frm-graph fields="x" drafts="both"]
-
created_at_greater_than
Only include entries created after a specific or dynamic date. For example, you may show entries created in the last month with created_at_greater_than="-1 month" or use a specific date like created_at_greater_than="2016-07-31". When using a specific date, it must be in the Y-m-d format.
[frm-graph fields="x" created_at_greater_than="Y-m-d"]
To filter a graph to show entries created in the current month using the entry creation date for comparison.
[frm-graph fields="1709" type="column" created_at_greater_than="[date format='Y-m']-01"]
-
created_at_less_than
Only include entries created before a specific or dynamic date. For example, you may show entries created before today with created_at_less_than="-1 day" or use a specific date like created_at_less_than="2016-05-31". When using a specific date, it must be in the Y-m-d format.
[frm-graph fields="x" created_at_less_than="-1 month"]
-
limit
Limit the number of bars, coordinates, or pie slices displayed in the graph. This will limit the graph to the highest values.
[frm-graph fields="x" limit="5"]
-
field is equal to
Only include entries where another field in the form has a specific value. For example, you may want to only graph entries where your Terms and Conditions field has a value of 'Yes'.
[frm-graph fields="x" y="Yes"]
Replace y with a field ID or key.
-
field is NOT equal to
Only include entries where another field in the form is NOT equal to a specific value. For example, you may want to only graph entries where a status field does NOT have a value of 'Pending'.
[frm-graph fields="x" y_not_equal="Pending"]
Replace y with a field ID or key.
-
field is greater than
Only include entries where another field in the form is greater than a specific value. For example, you may want to only graph entries where a date field has a value greater than 2016-01-01. Replace y with a field ID or key.
[frm-graph fields="x" y_greater_than="2016-01-01"]
To filter a graph to show entries created in the current month using a date field for comparison.
[frm-graph fields="1709" type="column" 1710_greater_than_or_equal_to="[date format='Y-m']-01"]
-
field is greater than or equal to
Only include entries where another field in the form is greater than or equal to a specific value. For example, you may want to only graph entries where a date field has a value greater than or equal to 2016-01-01.
[frm-graph fields="x" y_greater_than_or_equal_to="2016-01-01"]
Replace y with a field ID or key.
-
field is less than
Only include entries where another field in the form is less than a specific value. For example, you may want to only graph entries where a date field has a value less than 2017-01-01.
[frm-graph fields="x" y_less_than="2016-01-01"]
Replace y with a field ID or key.
-
field is less than or equal to
Only include entries where another field in the form is less than or equal to a specific value. For example, you may want to only graph entries where a date field has a value less than or equal to 2017-01-01.
[frm-graph fields="x" y_less_than_or_equal_to="2016-01-01"]
Replace y with a field ID or key.
-
field contains
Only include entries where another field in the form contains a specific value. For example, you may want to only graph entries where a checkbox contains the value "Morning".
[frm-graph fields="x" y_contains="Morning"]
Replace y with a field ID or key.
-
get param
Filter the entries by retrieving the value from the URL using a parameter.
[frm-graph fields="x" type="column" data_type="count" y=[get param='url-filter']]
Replace x with the ID of the field that you want to graph. Replace y with the field you want to filter against, then replace the url-filter with the param name in your URL.
This parameter won't work directly on published pages. For this to function as expected, you'll need to implement it within a View.
Additional examples
The filtering parameters accept PHP's strtotime-compatible phrases. Here are practical examples for common filtering needs:
Full previous months (complete months only)
[frm-graph fields="x" created_at_greater_than="first day of 6 months ago" created_at_less_than="first day of this month"]
Shows the last 6 complete months, excluding the current partial month.
Previous year
[frm-graph fields="x" created_at_greater_than="first day of January last year" created_at_less_than="first day of January this year"]
Since yesterday
[frm-graph fields="x" created_at_greater_than="yesterday"]
This week (starting Monday)
[frm-graph fields="x" created_at_greater_than="monday this week"]
Last full week (Monday to Sunday)
[frm-graph fields="x" created_at_greater_than="monday last week" created_at_less_than="sunday last week"]
From the start of a specific month this year
[frm-graph fields="x" created_at_greater_than="first day of march this year"]
A specific month last year
[frm-graph fields="x" created_at_greater_than="first day of june last year" created_at_less_than="last day of june last year"]
Styling graphs
Since our graphs rely on Google charts HTML5/SVG technology, you can refer to their documentation on specific styling questions.
Examples
Stepped area totals
Create a stepped area graph with type="stepped_area". Set an x-axis with the x_axis parameter and graph field totals with the data_type parameter.
[frm-graph fields="254" x_axis="253" type="stepped_area" title="My Graph" x_title="X axis title" y_title="Y axis title" data_type=total bg_color="#ebf0fa" colors="#FF0000" grid_color="#9900cc"]
Colorful columns
Set custom colors in a graph using the colors parameter.
[frm-graph fields="255" type="column" title="Favorite Color" colors="#21759B, #1C9E05, #EF8C08, #FF0000"]
Pie 3D
Create a pie graph and make it 3-dimensional using the is3d parameter. Also, move the legend to the left side of the graph using the legend_position parameter.
[frm-graph fields="255" width="100%" title="My Pie Graph" type="pie" show_key="1" legend_position="left" is3d="true"]
Donut chart graph
Create a donut chart. Customize the size of the hole by using the pie_hole parameter.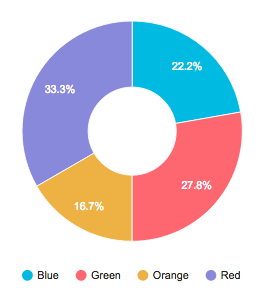
[frm-graph fields="255" type="pie" pie_hole=".4" title="" show_key="1" legend_position="bottom"]
Smooth line graph
Create a line graph with smooth lines using the curve_type parameter. Also make the labels on the x-axis horizontal by using the x_slanted_text parameter.
[frm-graph fields="253,255,256" x_axis="created_at" x_slanted_text="0" type="line" curve_type="function" width="100%" chart_area="height:40%,width:60%" title="Curve Line Graph" title_bold="true" show_key="1" legend_size="20" y_title="# of Submissions" x_title="Date Created"]
Geo chart
Create a geo chart and select the colors you would like using the colors parameter. By default, the graph is displayed with a legend. You can use [frm-graph fields="258" type="geo" show_key="0"] instead to hide the legend.
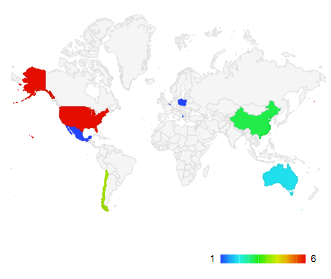
[frm-graph fields="258" type="geo" colors="#2A48F4, #1DA7F0, #1AEFE9, #16EE97, #13EC44, #80EA0C, #D2E809, #E7AA06, #E65303, #E50005"]
To create a geo chart that displays the values from another field, use the x_axis and data_type parameter.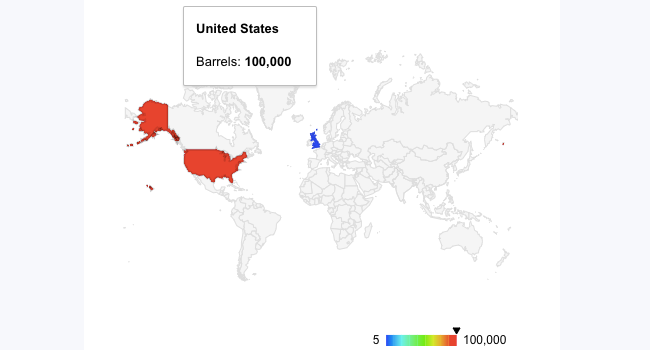
[frm-graph fields="5507" x_axis="5506" type="geo" data_type="total"]
Where 5507 is the Barrels field and 5506 is the Country field.
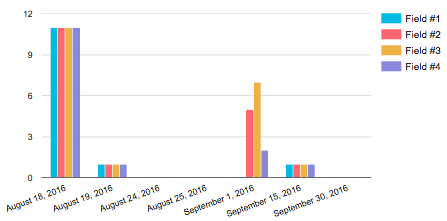
Stacked Bar Graph
Create a stacked bar graph with the is_stacked parameter. Set an x-axis with the x_axis parameter and graph multiple fields.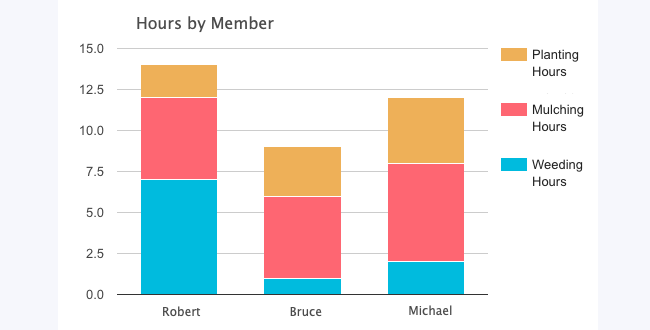
[frm-graph fields="401,402,403" x_axis="405" is_stacked=1 title="Hours by member" data_type=average show_key=1]
Where 401, 402, 403 are the field IDs for each activity and 405 is the field ID for each member.
Data over time
There are many use cases for showing values over time. These include weight tracking, revenue totals by day, and many more. These types of graphs can either use the creation date or a date field for the x-axis.
Weight over time
Replace 100 with the id of your weight field and 101 with the date field. For this graph, the form should also include a User ID field.
[frm-graph fields="100" x_axis="101" type="line" title="Weight Tracking" data_type=average user_id=current]
Revenue per day
Replace 100 with the id of your revenue field and "created_at" with the id of the date field if you have one.
[frm-graph fields="100" x_axis="created_at" type="line" title="Revenue Per Day" data_type=total]
Entries by month
Replace 100 with the ID of the field that you want to graph. Replace "2021-03-01" and "2021-03-31" with the first and last day of the month.
[frm-graph fields="100" x_axis="created_at" created_at_greater_than="2021-03-01" created_at_less_than="2021-03-31" group_by="month" data_type="count" type="line" title="Entries for March"]
Entries for certain period
Display entries that were created after a specific or dynamic date with the created_at_greater_than parameter. For example, this shortcode will show entries created in the last 90 days.
[frm-graph fields="101" created_at_greater_than="-90 days"]
Entries for current month
Display the entries for the current month based on the entry creation date using the created_at_greater_than and data_type parameters. Replace 1491 with the field whose value you want to include.
[frm-graph fields="1491" data_type=total created_at_greater_than="first day of this month"]
To use a Date field rather than created_at, use the y_greater_than parameter. Replace 1492 with the ID of the Date field.
[frm-graph fields="1491" data_type=total 1492_greater_than="first day of this month"]
PHP Alternative
If you would like to insert a graph with PHP, you may use the code below.
echo FrmProGraphsController::graph_shortcode(array('fields' => x));All shortcode parameters from above can be used in this function.
Related developer hooks
- Add or change the styling options in your graph with the frm_google_chart hook.
- Manipulate all the data in a graph (including the labels, rows, and columns) with the frm_graph_data hook.
- Replace the No Data message that appears when there is nothing to display with the frm_no_data_graph hook.
- Change a graph value with the frm_graph_value hook.
- Change the ID used for a graph with the frm_graph_id hook.
