An effective way to display data on your WordPress form is to use the Formidable Charts add-on. It simplifies embedding a chart into a page with the Chart block. This feature enables you to create visually appealing charts and graphs to boost conversions on your site.

Upgrade your WordPress site with powerful, flexible forms.
Download and install
- If you haven't already, install and activate the current version of Formidable Forms Premium on your WordPress site.
- After confirming your Formidable Forms license, proceed to the Formidable → Add-Ons page and toggle on the Charts add-on.


From Idea to Reality in Minutes. Build Powerful Forms, Dashboards, Apps and More.
Formidable Forms makes advanced site building simple. Launch forms, directories, dashboards, and custom WordPress apps faster than ever before.
Add a chart block
Generate charts and graphs directly within your WordPress forms by utilizing the block editor on a page or post, where you'll instantly see a preview of your changes. Follow the steps below to get started.
- Install the Charts add-on. Before creating a chart block, you must first install the Charts add-on.
- Insert a chart block into your page. Go to an existing WordPress page or create a new one. In the block editor, click the (+) icon and search for the Formidable Chart block. Click the block to insert it into your page or post.
Alternatively, you can click the (+) icon from the left sidebar and type in Formidable Chart in the search bar. Drag and drop the block into the page/post editor.
- Edit your chart settings. The chart block settings are on the right side of the page editor. Select the form and fields where the data will be sourced.
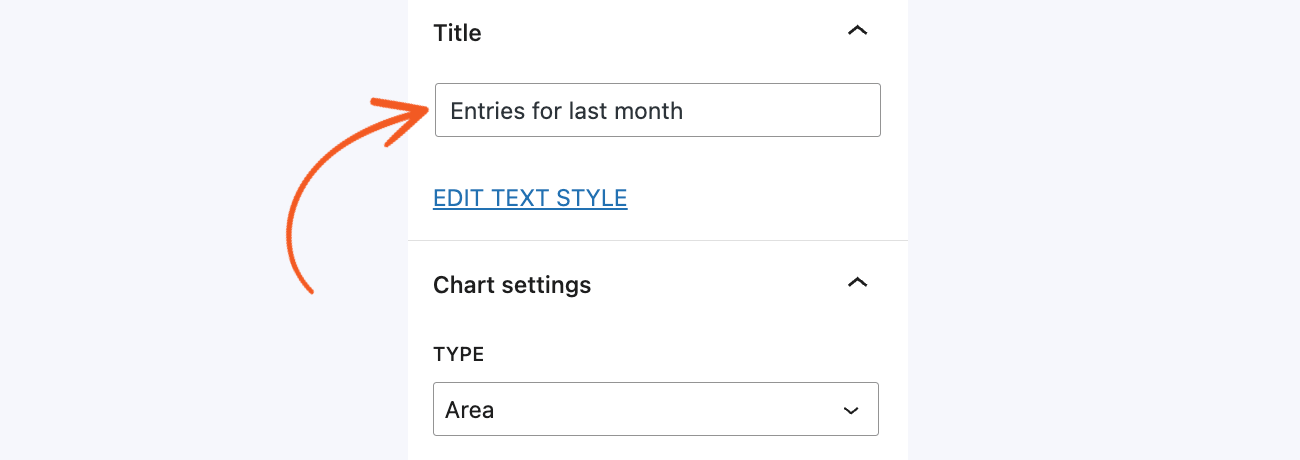
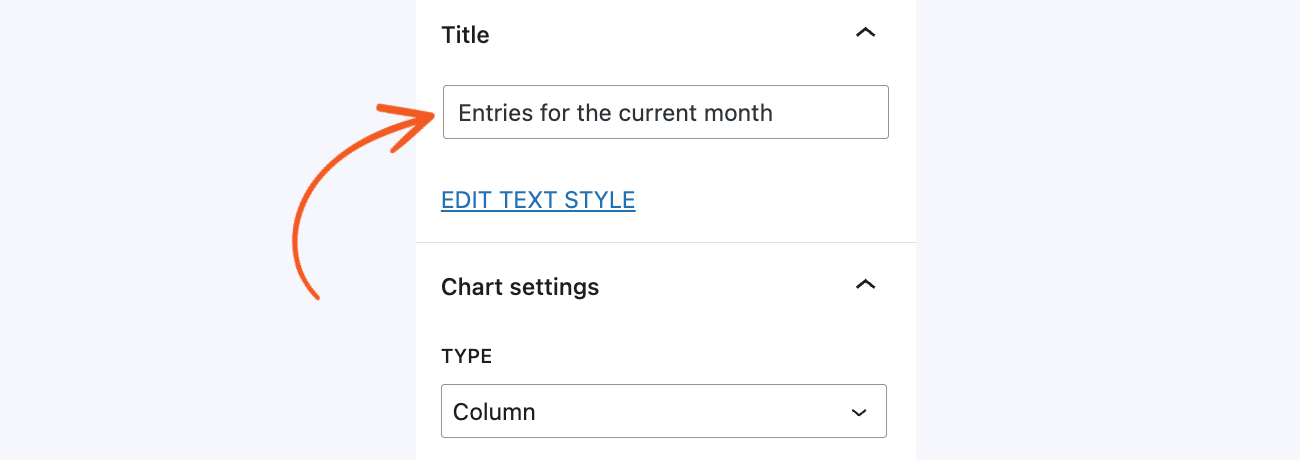
- Add a title. Click the Edit Text Style link to change the title.
- Select a chart type. Choose a chart type from the dropdown.
- Filter and limit the data. Click the Add Filters link if you need to filter the data displayed on the chart. Read more on how to add a filter.
- Configure the horizontal and vertical axis. Learn more about customizing the chart options for the x-axis and y-axis.
- Customize the styling. Learn more about styling the chart.
 Alternatively, you can click the (+) icon from the left sidebar and type in Formidable Chart in the search bar. Drag and drop the block into the page/post editor.


Basic settings
Select your chart block and navigate to the right sidebar within the page editor to add a chart to a page. Once selected, you'll be presented with the basic settings, which allow you to customize the chart according to your requirements.
Select a form
In the primary datasource section, choose a form where the data will be sourced to display the chart.Select fields
Select one or more fields to include in the chart. You can combine the filter and sort settings to determine how the data will be displayed in the chart.Add filter
Filter and limit the data shown in the chart. Data can be filtered based on user ID, entry, and status. To add a filter, go to the Primary Data Source section in the chart blocl settings and click the Add Filters link. Select a filter and insert the filtering value. Click the Add Filter button if you need to add more filters.Sort fields
When you select multiple fields to be included in the chart, you can sort their order using the drag-and-drop feature.Chart type and title
Set a title for the chart and choose from the nine available chart types: Column, Horizontal bar, Pie chart, Line, Area, Scatter, Stepped, Map, and Table.


Advanced settings
If you have selected a chart type with horizontal and vertical axes, such as column, horizontal bar, line, area, scatter, and stepped, you can configure the chart's x-axis and y-axis.
Horizontal axis
You can customize the display options for the x-axis in the horizontal axis section. Adjust the settings for each property, such as data source, data type, data over time graph, x-axis title, minimum value, and maximum value. If you need to configure the other options, click the Add More Properties link.
- Data source: Define the x-axis with the ID of a second field from the same form. You can also use created_at or updated_at to graph entries over time.
- Data type: Select whether to display the number of entries, add the field values together, show the average of the totaled field values, or display the highest or lowest of a set of field values.
- Data over time graph: Toggle this option to show values on the chart over time.
- X-axis title: Add a title to the x-axis.
- X-axis minimum and maximum value: Set the minimum and maximum values of the x-axis.
Vertical axis
You can customize the display options for the y-axis in the vertical axis section. Adjust the settings for each property, such as the y-axis title, minimum value, and maximum value. If you need to configure the other display options, click the Add More Properties link.
- Y-axis title: Add a title to the y-axis.
- Y-axis minimum and maximum value: Set the minimum and maximum values of the y-axis.


Styling the chart
With the Formidable Chart, you can customize how the chart will be displayed on the page with a live update preview as you configure the styling options. Scroll down to the Appearance section to see the available options such as: height, width, and graph color. If you need to configure the other display options, click the Add More Properties link.
- Size: Configure the height and width of the displayed chart.
- Colors: Select the colors you want to use on the graph. By default, the color palette is preloaded with ten choices, one for each field. Use the color picker to choose a custom color or your theme color.
- Legend: If you are working with multiple fields in your chart, display a legend and choose where it should be positioned to ensure that your chart is easily understandable and effectively presents the data.


Add a custom chart color
By default, the color palette is preloaded with ten color choices, one for each field. You can select a color by choosing a custom color using the color picker or your theme colors. This is how the color palette appears in the Chart block settings.

Display a legend
If you are working with multiple fields in your chart, add a legend to ensure that your chart is easily understandable and effectively presents the data.
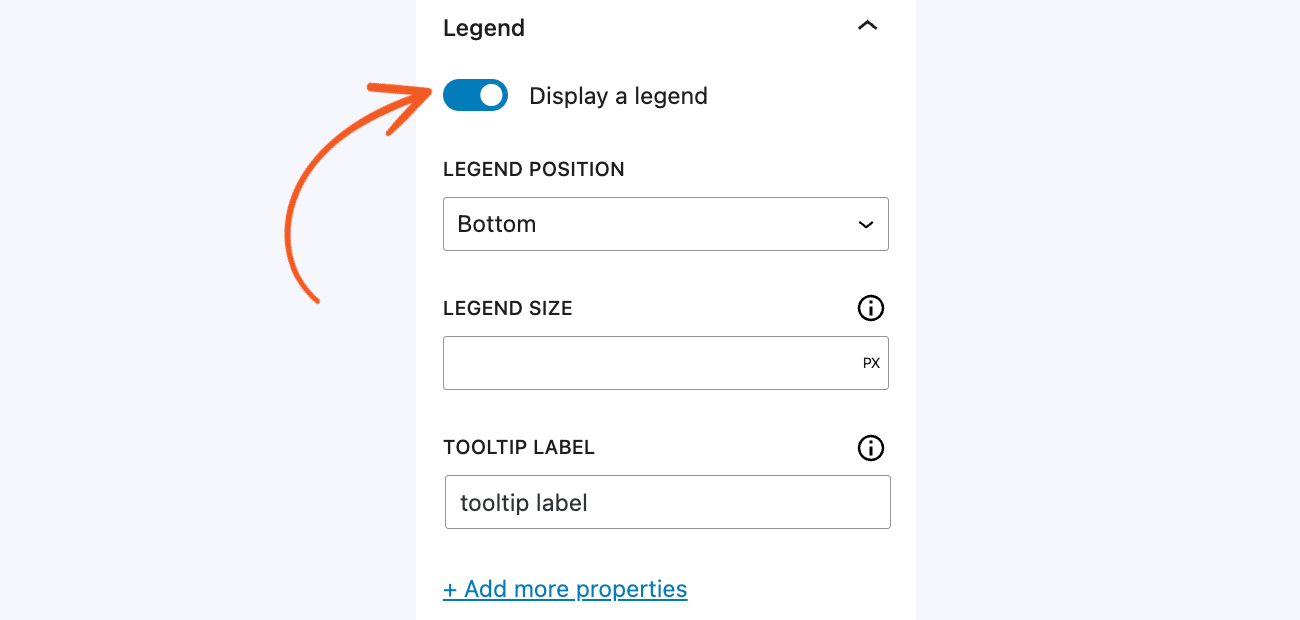
- Click to toggle the Display a Legend option.
- Choose where to place the legend by selecting an option from the Legend Position dropdown.
- The other legend properties are hidden by default. Click the Add More Properties link to adjust the legend size and tooltip label settings.
Examples
Display chart for current month entries
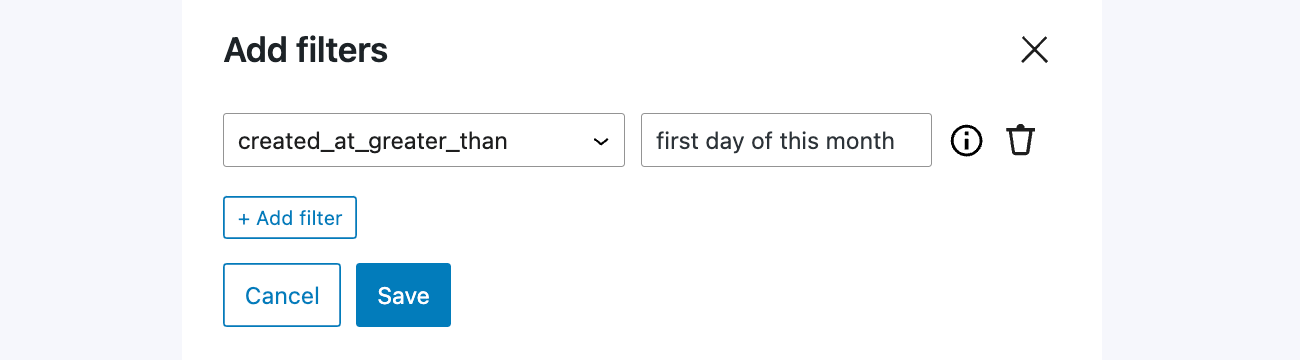
If you would like to create a chart that shows the entries for the current month based on the entry creation date, follow the steps below.
- Add a Formidable Chart block to your page.
- Choose a primary datasource that contains the necessary data you want to display on the chart. Select a form and at least one field that you want to use.
- Once you have chosen a form and field to work with, set up the filter like created_at_greater_than - first day of this month.
- Give your chart a title and select a chart type.
- Under Horizontal Axis, set the data source to created at and the data type to Add the field values together.
- To save your settings, click the Publish or Update button on the page. When the page is visited, it should look something like this.


Display chart for last month entries
If you would like to create a chart that shows the entries from last month based on the entry creation date, follow the steps below.
- Add a Formidable Chart block to your page.
- Choose a primary datasource that contains the necessary data you want to display on the chart. Select a form and at least one field that you want to use.
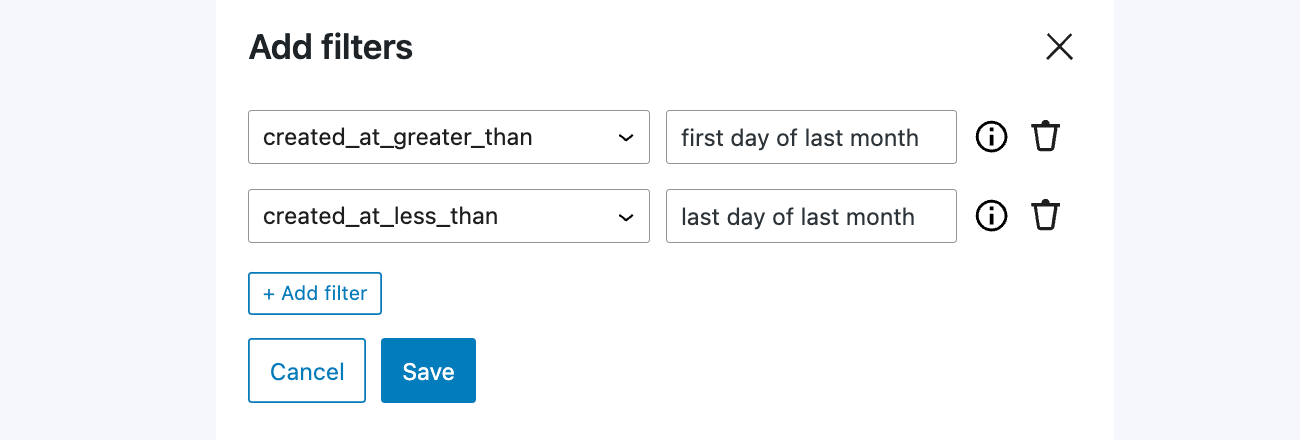
- Once you have chosen a form and field to work with, set up the filter like:
- created_at_greater_than - first day of last month
- created_at_less_than - last day of last month
- Give your chart a title and select a chart type.
- Under Horizontal Axis, set the data source to created at and the data type to Add the field values together.
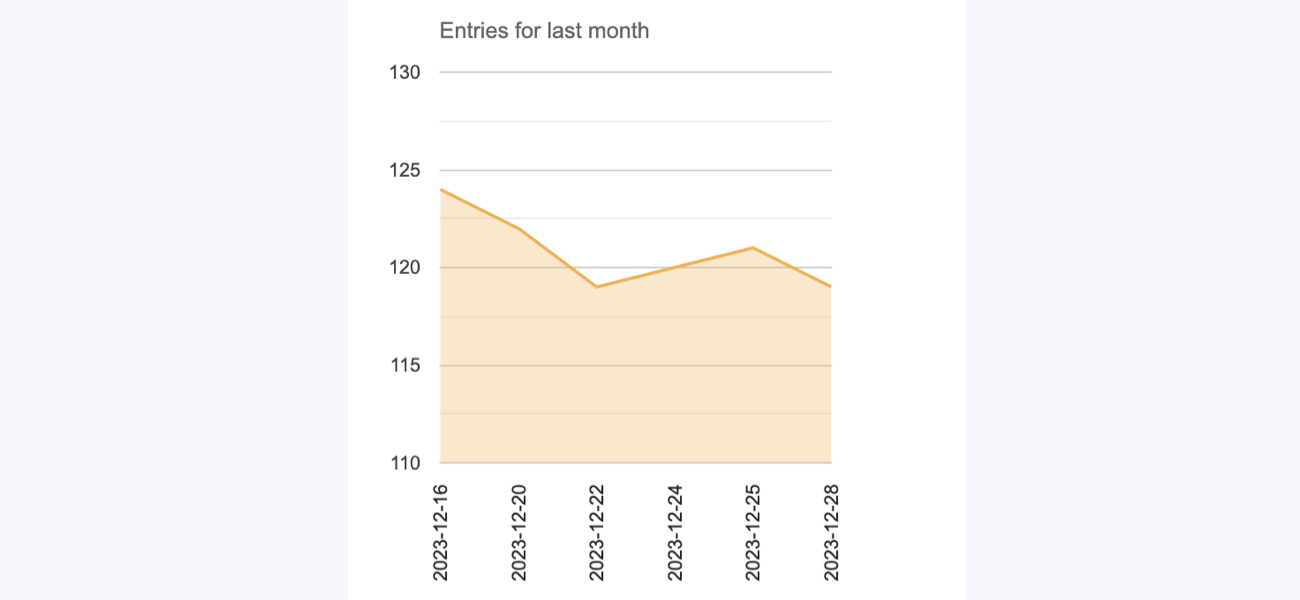
- To save your settings, click the Publish or Update button on the page. When the page is visited, it should look something like this.